Data gathering and requirements
This module covers week 10 of the course.
Data gathering
Five issues in data gathering
- Setting goals (How will the data be used?)
- Identifying participants (Who are the users/stakeholders? How many to work with?)
- Relationship with participants (Keep it professional; get consent when appropriate)
- Triangulation (look at data in multiple ways)
- Pilot studies (conduct a small trial run of the main study)
Data recording: Notes, audio, video, and photographs all useful.
Interviews
Different ways of conducting interviews:
- Structured
- Unstructured
- Semi-structured
- Focus groups
Questionnaires
- Well-established technique for gathering demographic data and user options
- Rely on users to be motivated enough to answer without being prompted
- Questions must be clear because interviewers isn't there to clarify anything (Sharp et al. 2019).
Questionnaire structure
- The order of questions is important
- Do different groups require a different version of the questionnaire?
- Consider how long the questionnaire is. Keep it focused and compact.
- Think about the layout and pacing.
Format
Consider which formats - such as ranges or check boxes are appropriate for the type of data you want to collect.
Likert scales (an example here from N/N group) are a useful way of measuring opinions, beliefs, attitudes, and so on.
Participants
As a student, you aren’t expected to conduct a survey of hundreds of participants! In interaction design research, it isn’t unusual to have fewer than 20 participants.
Online questionnaires are relatively easy and quick to distribute—common to use Google Forms or Microsoft Forms.
Observation
Can occur directly (for example, as an ethnographic study, where the researcher interacts with participants), or indirectly (through the use of diaries, video equipment, online tracking/logging, etc.). Ethnography can now occur online (See “Netnography”).
Data
- Can be quantitative or qualitative.
- Quantitative = numbers
- Quantitative analysis means numeral methods used. Useful for larger sample sizes.
- Qualitative = words (useful when numbers don't explain adequately)
- Qualitative analysis = Themes or patterns emerge. Useful for capturing more nuanced information.
There are also mixed methods that rely on both quantitative and qualitative data and analyses.
Data analysis tools
- Spreadsheet software, such as Excel and Numbers, which include basic graphs
- Google forms (also includes basic graphs)
- Statistical packages such as SPSS
- Qualitative data analysis software such as Nvivo and CAQDAS
The System Usability Scale (SUS)
Though created by John Brooke in 1986, the SUS is still used frequently because it's a "quick and dirty" way of measuring usability. It's used to measure usability of all kinds of software and hardware systems and applications.
usability.gov (n.d.). System Usability Scale (SUS). https://www.usability.gov/how-to-and-tools/methods/system-usability-scale.html
The original System Usability Scale (SUS):
- I think that I would like to use this system frequently.
- I found the system unnecessarily complex.
- I thought the system was easy to use.
- I think that I would need the support of a technical person to be able to use this system.
- I found the various functions in this system were well integrated.
- I thought there was too much inconsistency in this system.
- I would imagine that most people would learn to use this system very quickly.
- I found the system very cumbersome to use.
- I felt very confident using the system.
- I needed to learn a lot of things before I could get going with this system (Brooke, 1986).
What is a requirement?
"A statement about an intended product that specifies what it is expected to do or how it will perform" (Sharp et al. 2019, p. 387).
User stories are a useful way of creating requirements. Often stated as:
“As a <role>, I want <behaviour> so that <benefit>” (Sharp et al., 2019, p. 388)
Different kinds of requirements
- Functional requirements
- Data requirements
- Environmental requirements
- User characteristics
- Usability goals
- UX goals (Sharp et al., 2019)
Requirements
Requirements can be presented in a number of ways, such as the requirements shell in the reading.
See also this simple software requirement document template from Asana (2023):
-
Introduction
Who is this document intended for and why?
How will it be used? -
Product scope
What are the overall business goals of your product? -
Product value
Why is your product important?
How will it help your intended audience? -
Intended audience
Who is your product for? -
Intended use
What will this product be used for? -
General description
Give a summary of the functions the software would perform and the features to be included.
Further reading: Team Asana (2023). How to write a software requirement document (with template). https://asana.com/resources/software-requirement-document-template
Data gathering for requirements
- Interviews, observation, and questionnaires
- Studying documentation
- Researching similar products (useful for students doing assignments!)
Bringing requirements to life through personas and scenarios
Personas: Rich descriptions of typical users, not specific people
Scenarios: An informal narrative story, simple, ‘natural’, personal, and not generalizable (Sharp et al., 2019).
Example personas: Users of a bushfire information map application in rural Western Australia.
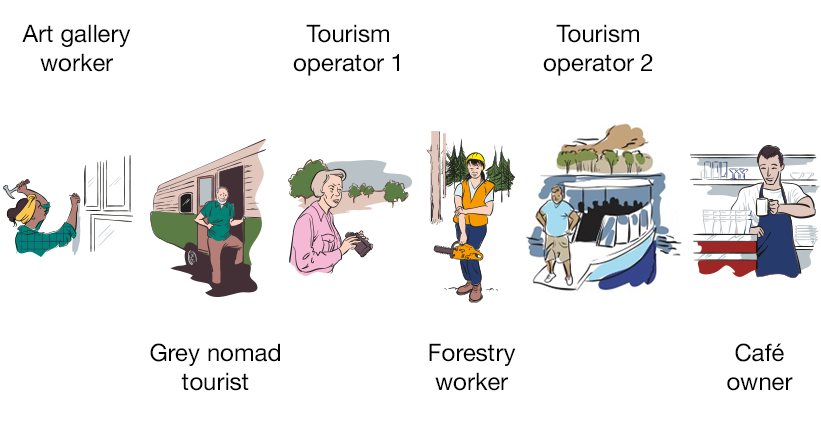
Illustration by Medley (2013). Note that the following details were elaborated for each in the research project they were used in:
- Overview
- Computer skills, knowledge and abilities
- Internet-enabled devices
- Expectations of the application
- Experience with existing map websites
Use cases focus on functional requirements and interactive elements. See these example use cases.
Back to top | © Paul Haimes at Ritsumeikan University | View template on Github