Outlook for commercial broadcasters in Japan
MIC Survey of Broadcaster Sentiment
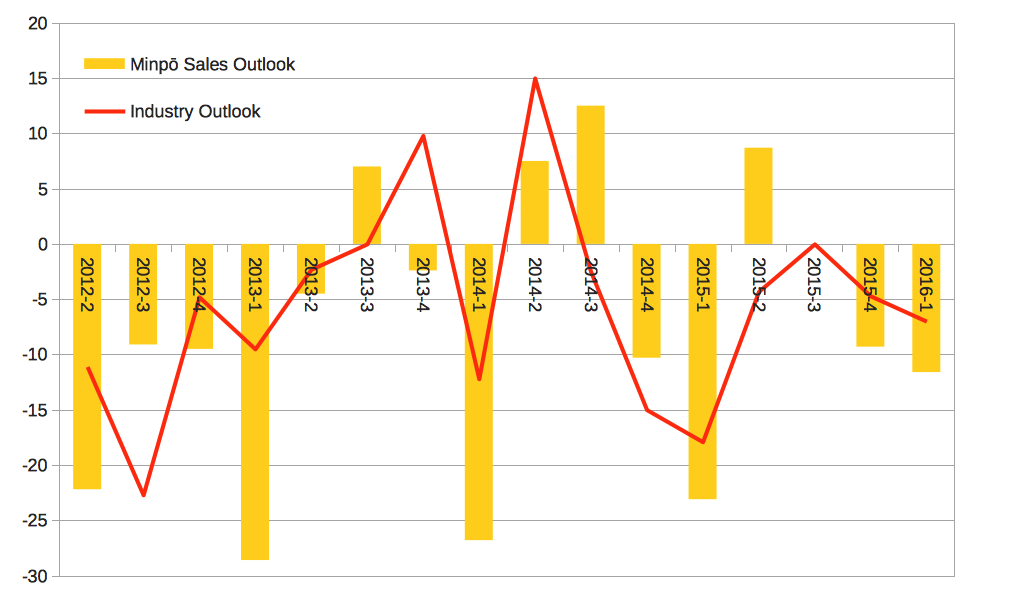
PUBLISHED: 18 Apr 2016The chart shows the latest (6 Apr 2016) results from the MIC’s industry sentiment/outlook survey. It is based on responses from 49 commercial broadcasters who are asked for their outlook for the upcoming two quarters.
The index is created by subtracting negative responses from positive; so the yellow bar graph, illustrating how broadcasters see their sales numbers developing (売上高見通し), shows the difference between the number of companies who think ‘sales will increase’ and those who think ‘sales will decrease.’1 The red line is the index for a more general ‘industry’ outlook (業況見通し).
The latest figure for 2015-Q4 and 2016-Q1 were both negative, indicating that more companies were pessimistic about the immediate future than were optimistic. The MIC survey reports…
民間放送事業は、[▲29.3]、[▲11.6]と両期ともに「マイナス」(売上高が減少すると判断した事業者の方が多い。)。見通しの判断要因は、両期ともに「CM等広告契約」が最も多く挙げられた。
The primary concern for broadcasters, or at least the one that most affected their outlook, is the prospects for advertising spend. Overall, this is also the primary factor driving the outlook for the industry as a whole:
民間放送事業は、[▲4.7]、[▲7.0]と両期ともに「マイナス」。見通しの判断要因は、両期ともに「広告契約の動向」が最も多く挙げられた。
Getting better (less bad)?
The published MIC survey results go back just two years but looking back a bit further (as my chart does) seems to reveal a pattern (or perhaps this is just a result of the human tendency to search for patterns in a chaotic world!). It looks like the broadcast industry is a lot more pessimistic regarding potential sales in the first quarter of any particular year. According to the published methodology these estimates are made at the end of third quarter of the previous year.
However, the amount of pessimism seems to be decreasing; but I think it’s debatable as to whether less pessimism means more optimism, after all the survey asks companies how they see things changing and after a long period of things getting worse maybe there’s a tendency to assume that things just can’t get any worse. Or at least there may be a feeling that the rate of decline is beginning to bottom out.
If you want more data, quarterly surveys going back to 1996 can be found here.
Data for chart above
| ’12-2 | ’12-3 | ’12-4 | ’13-1 | ’13-2 | ’13-3 | ’13-4 | ||
|---|---|---|---|---|---|---|---|---|
| Minpō Sales Outlook | -22.2 | -9.1 | -9.5 | -28.6 | -4.5 | 7 | -2.4 | |
| Industry Outlook | -11.1 | -22.7 | -4.8 | -9.5 | -2.3 | 0 | 9.8 |
| ’14-1 | ’14-2 | ’14-3 | ’14-4 | ’15-1 | ’15-2 | ’15-3 | ’15-4 | ’16-1 | |
|---|---|---|---|---|---|---|---|---|---|
| Minpō Sales Outlook | -26.8 | 7.5 | 12.5 | -10.3 | -23.1 | 8.7 | 0 | -9.3 | -11.6 |
| Industry Outlook | -12.2 | 15 | -2.5 | -15 | -17.9 | -4.3 | 0 | -4.7 | -7 |
Other articles in ‘Research’
- Capturing the content of news websites · Developing techniques to capture news websites programmatically.
- MIC Survey of Broadcaster Sentiment · Outlook for commercial broadcasters in Japan
- Selling the news in Japan · Hopefully a paper some time soon…
- Hazlitt article · Press on my research
- Camera angles study · Book chapter
- Productivity Surprises · Hi-ho Hi-ho, it’s off to work we go…
- Social Distance Portrayed · Visual Communication paper
- At the Digital Watershed: Terrestrial Television Broadcasting in Japan · Japanese Studies paper
- How many is enough? · Bank Accounts in Japan
- NHK announces licence fee payment rates · Television licenses
- Reading news images in Japan: Visual semiosis in the context of television representation. · PhD Thesis
- Blog
RESEARCH
blog content research japan television